- Starter
- Why use spreadsheets?
- Tutorial Video
- Activity 1
- Auto Functions
- Activity 2
- Activity 3
- Resources
Why use spreadsheets?
Thinking back to the starter, how many of you found the activity…
- Too easy / too hard
- Too fast / too slow
Creating Tables and Charts
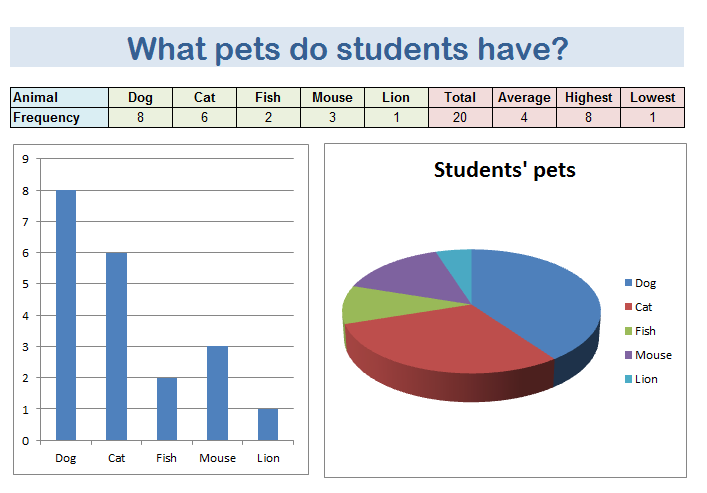
Follow the steps in the video to create a table and chart the is similar to the image below
Tutorial Video
Using what you have learned from the video, create a spreadsheet like the one below:
Activity – Class Poll
You now need to go round the class and complete a poll of their favourite colour, football team, etc.
Now create your own spreadsheet using the results and customise your sheet to make it look professional.
Example poll ideas:
- Favorite football team
- favourite teacher
- number of siblings
- weight
- eye color
- favourite country
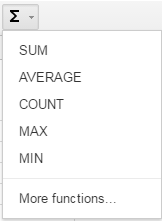
Auto Functions
Most spreadsheet software packages have in built functions that can be used to
- Sum – Add all the values in a range
- Min – Find the smallest value in a range
- Max – Find the largest value in a range
- Average – Find the mean average value in a range
Google Sheets

Activity 2
Log in to Google Classroom and go to today’s assignment. Open the assignment presentation and paste a screenshot of your chart / table on to the first page of the presentation.
You should use the snipping tool and Control+V to paste your code in to the presentation
Activity 3
Log in to QuizMaster and complete today’s quiz.