(ERD)
Entity-Relationship Diagrams (ERD)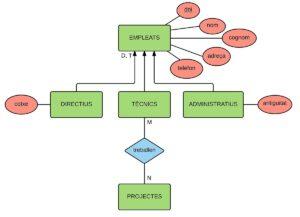

Visual representation of entities and their relationships in a database
Used to design and understand relational databases
Includes entities, attributes, relationships and cardinality symbols
(DFD)
Data Flow Diagrams (DFD)
Visual representation of how data flows through a system
Used to model “as-is” and “to-be” systems
Includes external entities, processes, data stores, data flows and data transformations
(PFD)
Process Flow Diagrams (PFD)
Visual representation of how processes, equipment, instruments and controls work together to produce a product
Used to understand and optimize processes
Includes process and equipment symbols, instrumentation and controls
Flowcharts
Flowcharts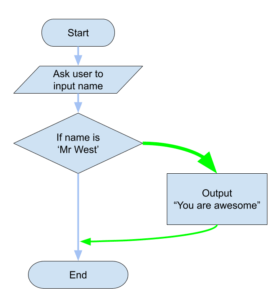
Visual representation of a process
Used to understand, evaluate and improve processes
Includes process steps, decisions, inputs and outputs
Use Case Diagrams
Use Case Diagrams
Visual representation of actors, use cases and their relationships in a system
Used to understand and validate user requirements
Includes actors, use cases, associations and multiplicity
Mockups
Mockups
Visual representation of a user interface
Used to communicate and validate design ideas with stakeholders
Includes screen layouts, buttons, text, images and other elements
Others
Others
Other commonly used visual modeling tools include: State diagrams, Activity diagrams, Sequence diagrams, Class diagrams, Object diagrams
Used in different domains and contexts to represent various aspects of a system
Resources
Resources
Teacher Presentation