Introduction
Introduction to Flowcharts
flowchart is like a visual map that helps you understand and follow a process or make decisions step by step. It uses different shapes and arrows to show the order of actions or choices you need to take. Each shape in a flowchart represents a different action or decision, and the arrows show you the direction to move in. You start at the beginning and follow the arrows until you reach the end. It’s like having a visual guide that helps you stay organized and make better choices.
Flowcharts can be helpful when programming as the help you break problems down into subproblems in a visual way. They are also useful for explaining algorithms to non-programmers.
Flowchart Shapes
Flowchart Shapes
Start/End
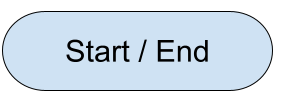
Represents the beginning or end point of the program.
Process/Action

Represents a specific task or action being performed, such as calculations, data manipulation, or function calls.
Input / Output
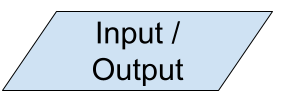
Represents the input or output of data to or from the program, such as reading user input or displaying results.
Decision / Conditonal
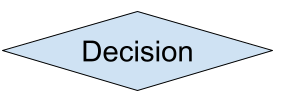
Represents a branching point in the program where a condition is evaluated, and different actions are taken based on the result, typically represented as a diamond shape. They usually contain a conditional statement, such as if statements, switch cases, or loops.
Arrow

The flow of the chart is indicated by arrows
Data Storage
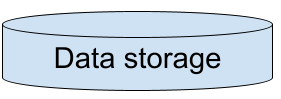
Indicates a read from / write to data storage
Subroutine/Function
Represents a separate block of code that is called and executed as a part of the main program, typically represented as a rectangle with rounded corners.
Example 1
Example 1 – Simple Flowchart with decision
Here is a simple flowchart example.

Simple flowchart example, source: Wikipedia
Example 2
Example 2 – Flowchart with loop

A flowchart with a loop. Source: Wikipedia
Practice
Practice Activities
Choose one of the following activities and write your own flowchart.
Story Flowchart
Create a flowchart based on a funny or adventurous story. Start by writing a short story with multiple paths and decision points. Then, translate the story into a flowchart, assigning different shapes and arrows to represent the actions and choices taken by the characters.
Recipe Flowchart
Choose a favorite recipe and create a flowchart to visualize the cooking process. Break down the recipe into individual steps and decisions, such as ingredient measurements, cooking times, and alternative options. Use flowchart symbols to represent each step, and arrows to show the flow of the cooking process.
Choose Your Adventure Flowchart
Design a flowchart that simulates a “choose your own adventure” game. Begin with a starting point and create branching paths based on different choices or actions. Add interesting consequences or outcomes to each decision point. This activity allows you to practice creating interactive and engaging flowcharts.
Day in the Life Flowchart
Imagine a typical day in your life and create a flowchart that represents the different activities and decisions you make throughout the day. Include actions like waking up, getting ready, meals, hobbies, and any other events. Use flowchart symbols to represent each activity and connect them with arrows to show the sequential flow of your day.
Board Game Flowchart
Invent a simple board game with rules and gameplay. Design a flowchart that outlines the different stages of the game, including setup, turns, actions, and victory conditions. Use flowchart symbols to represent each game component and connect them with arrows to show the flow of the game.
Resources
Resources